FLEXPART for Nord Stream leak
Methane leaks from the Nord Stream
NILU scientists estimated that the total methane leaks from the Nord Stream gas pipes could be at least 80 000 tons. That is more than four times the Norwegian national annual methane emission from the oil and gas industry.
Seismological data showed two explosions at the Nord Stream pipelines just off the Swedish / Danish coastline: Monday 26 September 02:03 and 19:03. On Tuesday, measurements from the Birkenes observatory in Agder, Norway, as well as several sites in Sweden, reported extreme methane concentrations in the air.
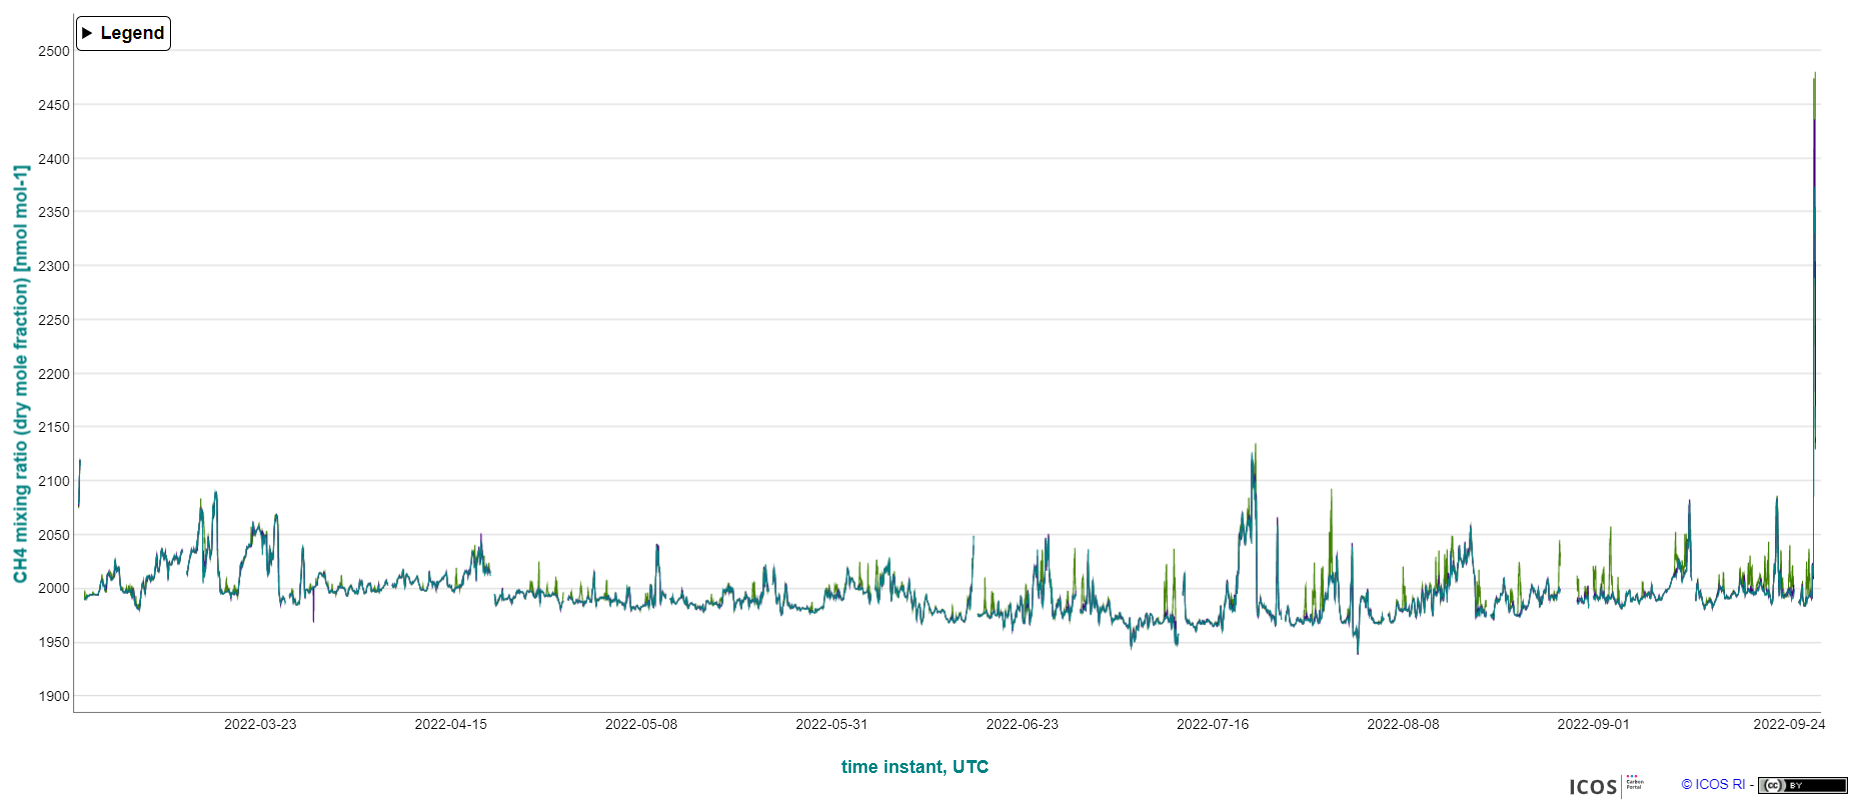
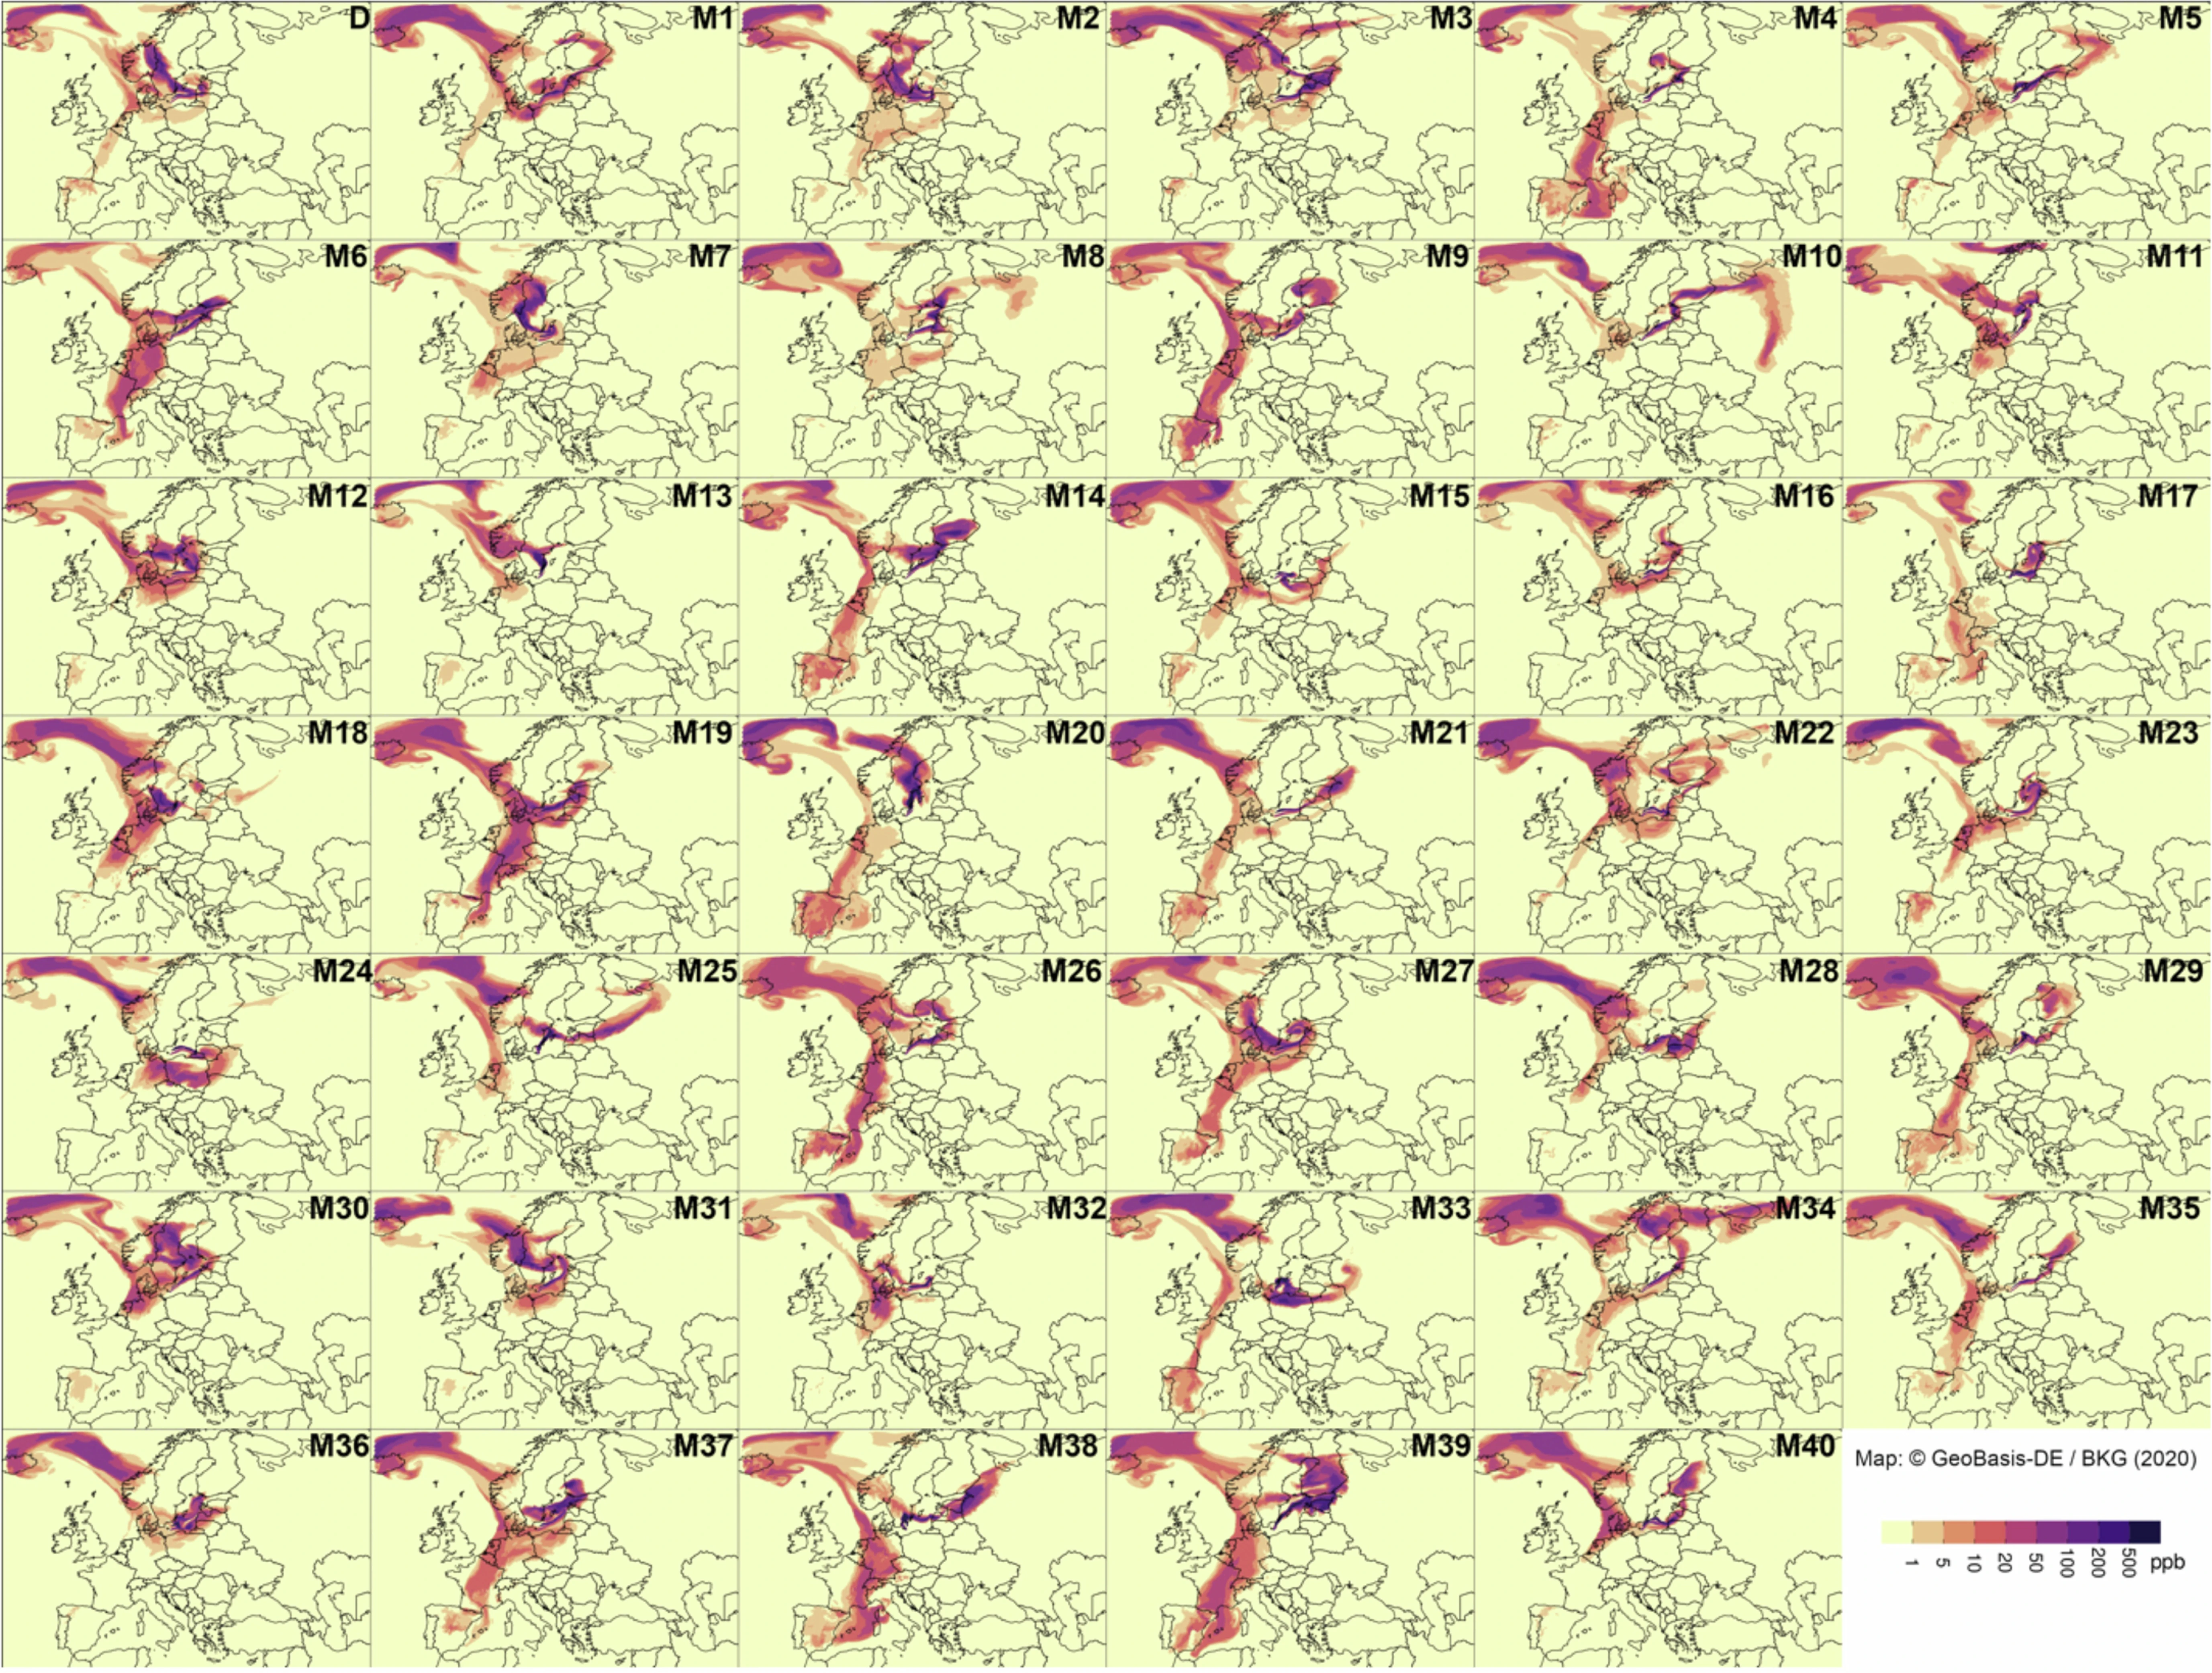
FLEXPART was used to simulate the transport and distribution of the methane gas cloud from the emissions. It suggested methane enhancements of several hundred parts per billion (ppb). A preliminary estimate of a possible gas release volume over 24 hours based on the size of the pipeline was calculated.
The simulation is based on data from ICOS monitoring stations. It does not show the total gas cloud, only the part near the surface. Horizontal resolution 100 x 100 km. NCEP meteorological data.
Platt,S. M., Myhre, L. and S. Eckhardt:https://nilu.com/2022/09/methane-leaks-from-nord-stream-a-serious-pollution-event/
Methane emissions from the Nord Stream subsea pipeline leaks
The amount of methane released to the atmosphere from the Nord Stream subsea pipeline leaks remains uncertain, according to Harris et al., 2025. After finding consistency between their modelled atmospheric emissions and top-down estimates, they found that 465 ± 20 thousand metric tons of methane were emitted to the atmosphere.
To model the evolution of atmospheric emissions from the leaks, Harris et al., 2025 simulated pipeline rupture emission rates and integrated these with methane dissolution and sea-surface outgassing estimates. They verify their modelled atmospheric emissions by comparing them with top-down emission-rate estimates derived from airborne measurements and point-source imaging satellites, as well as cumulative emission estimates from atmospheric inversion methods (using satellite and tall tower observations that incorporate prior atmospheric emission rates). The inversions use a range of atmospheric transport models: TOMCAT, FLEXPART, ICON-ART, STILT, TNO LOTOS–EUROS, CHIMERE.
The Lagrangian Particle Dispersion Model FLEXPART was driven by 0.2° meteorological data from ECMWF IFS. They employed a synthesis inversion approach assuming Gaussian errors. Both forwards and backwards simulations at different resolutions were used, with error correlations of 10% for R (for the inversions based on forward simulations).
Harris, et al., 2025 https://doi.org/10.1038/s41586-024-08396-8